Sunday, May 23, 2010

Best of this Week Summary 17 May - 23 May 2010

  • Codelab ("tutorial") from Google that "shows how web application vulnerabilities can be exploited and how to defend against these attacks. The best way to learn things is by doing, so you'll get a chance to do some real penetration testing, actually exploiting a real application. The codelab is built around Jarlsberg, a small, cheesy web application that allows its users to publish snippets of text and store assorted files. "Unfortunately," Jarlsberg has multiple security bugs ranging from cross-site scripting and cross-site request forgery, to information disclosure, denial of service, and remote code execution. The goal of this codelab is to guide you through discovering some of these bugs and learning ways to fix them both in Jarlsberg and in general."

  • A new IBM Redbook on WebSphere Messaging and High Availability has just been released.

  • A cool Android with Hudson continuous integration. Led on mobile phone changes color depending on the build status. Remember the Lava Lamps version?

  • Java dynamic proxies explained. They are for example used in Hibernate for lazy loading entities and in Spring for AOP. Also explains what CGLib proxies are for.

Sunday, May 16, 2010

Best of this Week Summary 10 May - 16 May 2010

Sunday, May 9, 2010

Best of this Week Summary 03 May - 09 May 2010

Tuesday, May 4, 2010

Clonezilla backup steps

In the last two years I had to get my harddisk replaced twice by a new one.
To minimize effort of setting up the new disk, I investigated which harddisk-copy program would best fit my needs, without complex setup things or complex instructions to create a bootable/live CD.

After trying several things, Clonezilla 1.2.2-31 did it for me.
I tried DriveImage XML, but that required me to make a streamlined CD for XP first, because I got a d:\i386\layout.inf not found error. I also looked at Paragon Backup & Recovery, but couldn't find how to create a live CD.

Creating a bootable live DVD was easiest with Clonezilla, and it's standalone, so no OS disks like Windows XP needed. The actual steps to make a backup a bit difficult for non-unix/linux people, but not impossible.
Below are the steps I now use to make a complete backup of my harddisk (including Windows) to a networked external disk via Samba.
Whether you can use these steps for your setup completely depends on your setup. Main reason for listing the steps here is so I have an easy reference to them :)

Prerequisites

  • Make sure you have an external harddisk connected to your network.

  • Make sure you have its IP address. If you're normally using DHCP, you might want to give it a fixed IP.

  • Make sure you have enough diskspace left on that external harddisk

  • To minimize network errors during the copying, you might want to use a network cable instead of a wireless connection. I definitely did that.

  • I used it for Windows XP, but any OS should do (it makes a byte-by-byte copy of the source disk


Steps to make copy
  1. Put the bootable CD/DVD in the drive to boot from it. Choose F8 or F12 at startup if you manually need to select your machine to boot from it.

  2. Wait until the boot sequence is done

  3. Choose language, and Don't touch keymap

  4. Choose Start Clonezilla

  5. Now you have to get the network card to get activated. That happens in the next steps

  6. Choose as Mount dir: samba_server

  7. Choose eth0. Choose DHCP

  8. Enter the IP of the networked external disk. E.g: 192.168.1.70

  9. I canceled the Domain configuration option

  10. Enter the account to use to connect to the networked external disk

  11. Pay attention when you enter the directory where the image must be stored. It is the directory in which the directory with the image information will be put. If you enter a non-existing directory, the mount (happens when you hit OK) will fail. Not a problem, just that you know. If the mount fails, just restart the process, this time with an existing path. Example path:


    /public/home/partimag


  12. Hit OK. This will start the mount command. It will ask you for a password if applicable. When the command is successful, you'll see the filesystem mount points listed.

  13. Choose Beginners Mode. Choose savedisk.

  14. Enter a name for the image. I usually append some more identifying information to the prefilled filename, which is something like: 2010-05-02-18-img

  15. Then choose the disk from the machine you want to make a backup for. For me it's only one: sda. Hit OK.

  16. Now you should see a summary of the command, which looks like:


    /opt/drbl/sbin/ocs-sr -q2 -c -j2 -z1 -i 2000 -p true savedisk "2010-05-02-18-img" "sda"


  17. Hit ENTER. That should start the backup. No errors should occur. My 500G harddisk with about 100G of data took about 4,5 hours to get backed up. One time I had an error in the output, saying something like the eth0 NIC was "gone". But the backup continued, and no other official errors were shown. It was not clear whether Clonezilla recovered successfully from the connection being away for a little while. Still, to be on the safe side, I made another backup, that had no network errors at all.


Steps to restore copy
These steps are about the same as making the copy, except that you select restoredisk instead of savedisk. But for completeness, here are the steps:

  1. Choose language

  2. Select Don't touch keymap

  3. Select Start Clonezilla

  4. Choose first option device_image

  5. Choose samba_server

  6. Choose eth0

  7. Choose DHCP

  8. Enter IP address of server you've stored the image on (e.g. 192.168.1.70)

  9. Cancel domain

  10. Enter account name to login on server

  11. Enter as directory: /public/home/partimag (note it's the same as when making the copy)

  12. Enter the password for the server. If correct, you'll see again the mount result (filesystem diskspace usage)

  13. Choose Beginner

  14. Choose Restore disk

  15. Choose the image you want to restore (e.g 2010-05-02-18-img)

  16. Choose target disk: sda

  17. Now you should see a summary of the command, which looks like:


    /opt/drbl/sbin/ocs-sr -g auto -e1 auto -e2 -c -r -j2 -p true restoredisk "2010-05-02-18-img" "sda"


  18. Hit ENTER. That should start the backup. No errors should occur. My 500G harddisk with about 100G of data took about 2,5 hours to restore.

Sunday, May 2, 2010

Best of this Week Summary 26 April - 02 May 2010

  • Google's Chief Java Architect Josh Bloch "discusses many of the problems facing the Java community, including the ineffectiveness of J2ME, licensing problems, Java 7's late ship date, and even the JCP issues that James Gosling often opined about. He points out that these problems predate the Oracle acquisition of Sun, so everyone should just stop pointing their fingers at Larry Ellison."

  • Another Getting Started blogpost for a Mahout-Taste based movie recommendation engine, which uses Wicket as presentation layer.

  • Martin Fowler explaining Inversion of Control and suggesting to call it the Dependency Injection pattern. Notes that the Service Locator pattern can also remove the dependency, just as the DI pattern tries to. Describes which of these options to use. Finally he also gives pros/cons for constructor vs setter injection. Also pros/cons for configuration in the code or via configuration files.

  • Several Javascript performance-optimization tips taken at JSConf 2010.

  • An article "which looks at various storage mechanisms - JDBC, JPA, JavaSpaces, Java Content Repository, MongoDB, and DB4O, primarily - from the perspective of how good they are at CRUD operations and queries". The conclusion is that there is no one "best" mechanism, each has its own best application.

Sunday, April 25, 2010

Best of this Week Summary 19 April - 25 April 2010

  • An introduction to Gizzard, an open sourced sharding framework (store data across multiple computers instead of on just one) which is used by Twitter.

  • A hands-on tutorial of creating a Spring application that uses Hibernate as JPA provider and JTA for transaction demarcation. A simple Order Processing Message Driven Bean is implemented that showcases this integration. It is deployed on a WebLogic 10.3 server.

  • Last week Jira from the Apache Foundation was compromised. Here's a description of how the hackers gained access via XSS.

Sunday, April 18, 2010

Best of this Week Summary 12 April - 18 April 2010

Sunday, April 11, 2010

Best of this Week Summary 5 April - 11 April 2010

Sunday, April 4, 2010

Best of this Week Summary 29 March - 04 April 2010

  • A short overview on what the differences are using Java in Google App Engine (and shortly mentioned in MS Azure) compared to "regular" JEE apps.

  • Three Java serialization options compared: Java Serialization, JSON Serialization and Google Protocol Buffers. Check also the comments here. Another benchmarking set can be found here.
    The protocol buffers solution was fastest in this test.

  • The third edition of Mastering EJB, is now available for free download off of TSS as PDF. The new edition includes more than 30 percent revised material and five new chapters covering security, integration, best practices, new EJB 2.1 features, as well as the latest open source Java solutions

  • Interesting read on the IT infrastructure (most of the article) in F1 racing.
    Some quotes: "each car has roughly 100 sensors placed in key data capture positions and send anywhere up to 20 gigabyes of data back to the pits during a race."
    "They are collecting four to six megabytes per lap. It depends on the track layout and the quality of the coverage but we transfer about 70 per cent in real time to the garage or the pits". And, did you know there's a connection with the factory during the race?

  • A funny observation that CSS has quite something in common with Aspect Oriented Programming! Includes a table which shows the similarities.

Sunday, March 28, 2010

Best of this Week Summary 22 March - 28 March 2010

Sunday, March 21, 2010

Android SDKs, screensizes and resolutions: comparable hardware

Trying to get an overview of the possible combinations of Android SDKs and screensizes and resolutions, *and* what physical devices are comparable, I came to the below overview. If you know some more comparable hardware, please let me know, I'll update the tables.

The first table shows the different screensizes defined as per Supporting Multiple Screens | Android Developers, mapped on real existing devices.


Id


Screensize, resolution, physical


Comparable hardware


A


QVGA (240x320, low density, small screen, 3.3”)


-


B


HVGA (320x480, medium density, normal screen, 3.9”)


HTC Hero 1.5 but really has 3.2”


C


WVGA800 (480x800, high density, normal screen, 3.9”)


Google Nexus One but really has 3.7”


D


WVGA854 (480x854 high density, normal screen, 4.1”)


Motorola Droid (aka Milestone) but really has 3.7” and Sony Ericsson Xperia X10 (screensize unclear)


E


WQVGA400 (240x400, low density, normal screen, 3.9”)


-


F


WQVGA432 (240x432, low density, normal screen, 4,1”)


-


The table below shows which SDK supports the above screensizes.


SDK


Screensize Id


1.5


B


1.6


B-D


2.0


B-F


2.0.1


B-F


2.1


B-F


Remarks:
  • The total nr of possible sdk+screensize combinations is 19!

  • Android has organized the screensizes and resolutions into three generalized sizes and three generalized densities, see here.

  • To support all these resolutions, you don't have to create icons/images for all possible combinations. By default Android tries to scale resources. Up to a certain limit it could be acceptable to let it do it for you, minimizing the number of images to create.

  • An example setting is minSdkVersion = 3, targetSdkVersion = 4 (where 3 = 1.5, 4 = 1.6). Targeting 1.6 ensures that different screensizes can be supported if the device has 1.6 or higher.

  • Cool skins you can find here. If you look at the configuration files, you can validate whether the screensize and resolutions are actually what you expect.

  • Sources: Droid, Nexus One, Hero, Xperia X10.

Best of this Week Summary 15 March - 21 March 2010

  • Twitter and Digg are moving from MySQL to Cassandra (a highly scalable second-generation distributed database, bringing together Dynamo's fully distributed design and Bigtable's ColumnFamily-based data model; a Facebook opensourced project). The reason for Digg for the move "is the increasing difficulty of building a high-performance, write-intensive application on a data set that is growing quickly, with no end in sight. This growth has forced them into horizontal and vertical partitioning strategies that have eliminated most of the value of a relational database, while still incurring all the overhead".
    Twitter has about the same reason: "No single points of failure", "Highly scalable writes (we have highly variable write traffic)", and "A healthy and productive open source community".
    Twitter tried HBase, Voldemort, MongoDB, MemcacheDB, Redis, Cassandra, and HyperTable amongst others before deciding to go with Cassandra. Interesting to read is how they slowly rollout Cassandra to limited sets of users.
    An introduction to Cassandra to get it up and running can be found here.


  • A short post on how to implement Automatic testing Oracle Service Bus using Hudson, Maven and SoapUI.

  • What to expect from HTML5 for webdevelopers.

Sunday, March 14, 2010

Best of this Week Summary 8 March - 14 March 2010

Sunday, March 7, 2010

Sunday, February 28, 2010

Best of this Week Summary 22 February - 28 February 2010

Sunday, February 21, 2010

Best of this Week Summary 15 February - 21 February 2010

  • Expected that Mozilla uses Agile everywhere, and definitely on its flagship Firefox? Think again, only recently they started to combine Agile and more traditional Waterfall as their new development model, dubbed "Lorentz".

  • Tips for hardening your Tomcat installation. Other implementation guides, not only limited to Tomcat (also for example WebLogic) tips from U.S. DOD DISA (Defense Information Systems Agency) can be found here.

  • Always interesting to at least quickly browse through: a review of the 1993 code of Doom. And more "today": the code of Doom for the iPhone reviewed.

  • Think you know Javascript? Try one of these quizes!

Sunday, February 14, 2010

Best of this Week Summary 8 February - 14 February 2010

  • Five new features of Spring 3.0 described:

    • Spring Expression Language (SpEL)

    • Object/XML Mapping (OXM) module

    • Type-conversion system

    • Formatter SPI

    • RESTful web services support

    What new Ajax simplifications have been introduced can be found here.

  • The Java EE 6 web tier introduces with Servlet 3.0 spec the ability for asynchronous processing of requests so that the thread may return to the container and perform other tasks. It also "adds annotation based configuration (@WebServlet, @ServletFilter and @WebServletContextListener) making the web.xml file optional, and introduces a new concept of web fragments."

  • Introductionary article to Apache Click. One difference between Click and Wicket is that Click is stateless by design, while Wicket is stateful. Both can be configured their "opposite" model, though these have their own pros/cons.
    Another main difference is that that Click uses templates (Velocity by default) where Wicket does not.

    Sidestep: here's a bunch of nicely designed Wicket sites that scale (note: not really clear where the scalability statements come from).

  • A 60 minutes presentation on how SOA is a hit at eBay.

Sunday, February 7, 2010

Best of this Week Summary 1 February - 7 February 2010

Sunday, January 31, 2010

Attacking memory problems on Android

Yay, my first post on Android :) Immediately attacking a difficult one: memory problems.


You might not run into them that quickly, but when you do, with a bit of bad luck, you've got a lot of work to do.
I've split the memory problems in two parts: out of memory (OOM) problems (this post) and stack overflow problems (a next post).

The maximum heap memory an process (app) gets in Android is 16M. That's not that much, a basic app takes already several MBs after you've only just started it.
So in the LogCat output you see something like when you run out of (heap) memory:


09-12 16:33:43.357: ERROR/dalvikvm-heap(157): 528640-byte external allocation too large for this process.
09-12 16:33:43.357: ERROR/(157): VM won't let us allocate 528640 bytes
09-12 16:33:43.357: DEBUG/AndroidRuntime(157): Shutting down VM
09-12 16:33:43.367: WARN/dalvikvm(157): threadid=3: thread exiting with uncaught exception (group=0x40010e28)
09-12 16:33:43.367: ERROR/AndroidRuntime(157): Uncaught handler: thread main exiting due to uncaught exception
09-12 16:33:43.387: ERROR/AndroidRuntime(157): java.lang.RuntimeException: can't alloc pixels
09-12 16:33:43.387: ERROR/AndroidRuntime(157): at android.graphics.Bitmap.nativeCreate(Native Method)
09-12 16:33:43.387: ERROR/AndroidRuntime(157): at android.graphics.Bitmap.createBitmap(Bitmap.java:343)


Now it could be you are just using too much memory. Trying to load 100 images of 800x600 pixels will just not fit into 16M when decoded to bitmaps.
But for any other "normal" app you can still run OOM after using it for a little while. For example even when you just open/close the same screen (Activity) for 20 times. That means you've got a memory leak. So where is it leaking, what memory can't the garbage collector (GC) set free?

With


adb shell procrank


you can get some information about your app's memory usage, but only a very rough idea.
A bit more specific information you can find by executing


adb shell dumpsys meminfo


DDMS also gives some rough info, but only some quite high-level info about objects being freed and allocated.

So still not enough info to really figure out what's going on: you'll see the memory usage will go over the 16MB limit at some point, at which the JVM will start complaining in the LogCat output it can't allocate the requested memorory.
But that you already knew :)

So you need something more detailed about what is when allocated and GC'ed. This is where the Eclipse Memory Analyzer Tool (MAT) comes into play.
Below I'll just give the steps you could apply to figure out where you're not freeing memory correctly and thus have a memory leak(s). All steps apply for a Windows + Eclipse environment, but should not be hard to apply to other setups.
The steps are based on input from several posts:


Analyzing memory usage steps

Make sure you've got your app running in the emulator via Eclipse. A real device should also work but I didn't try it. Probably sending the signal 10 needs to be done from w/in the code, see here. I'll assume you've already installed the MAT plugin.
  1. Start a Windows cmd shell. Go to the directory where you installed the Android SDK and go into the 'tools' subdirectory.

  2. First the directory /data/misc needs to be in mode 777 for the heap dump to be written. So execute:


    adb shell chmod 777 /data/misc


  3. Now you probably already have an idea which Activity is causing the OOM or might have a memory leak. To be able to easily spot it, open and close that Activity about 5 times. This makes sure it will stand out in the heap data. And, if you've opened/closed it 5 times, it should be fully GC'ed right? So if later on we see it still has 5 or 4 instances around, you know something is not cleaned up correctly!

  4. Find the process id (PID) you want an heap dump for. That is your app, identified by the package path of your app. So execute to look it up:


    adb shell ps


    Take the first column (named PID). Send a signal 10 to that process via:


    adb shell kill -10


    In your LogCat output you should see the VM heap being dump with lines similar to:


    01-31 15:29:34.112: INFO/dalvikvm(210): SIGUSR1 forcing GC and HPROF dump
    01-31 15:29:34.112: INFO/dalvikvm(210): hprof: dumping VM heap to "/data/misc/heap-dump-tm1264948174-pid210.hprof-hptemp".
    01-31 15:29:35.873: INFO/dalvikvm(210): hprof: dumping heap strings to "/data/misc/heap-dump-tm1264948174-pid210.hprof".
    01-31 15:29:36.652: INFO/dalvikvm(210): hprof: heap dump completed, temp file removed


  5. Now you need to copy the generated .hprof file from the emulator (or device) to your Windows machine, so execute:


    adb pull /data/misc/heap-dump-tm1264948174-pid210.hprof myheapdump.hprof


    Note that the bold part in the command matches the bold part in the 3rd LogCat line above.

  6. Since the hprof output from the Dalvik VM is not in the format the standard Java tools (including MAT) recognize, you need to fix that with this command (it just prepends a header or something):


    hprof-conv myheapdump.hprof mat_myheapdump.hprof


  7. As an extra step you can move the mat_myheapdump.prof file to another directory, so you won't fill up your working directory with .hprof files.

  8. Switch to the MAT perspective and open the file mat_myheapdump.prof you just created above. MAT will give you the option to already look at a few standard reports that could already give you an indication on what is using up a lot of memory. But often it will report 'java.lang.Class' and 'java.lang.string' as suspects, thus not telling you that much. Therefore: see next step.

  9. Click on the histogram icon:

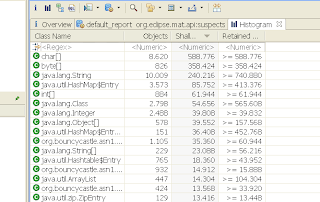
    That gives something like this:

    That just shows all classes in the heap dump. Note that again on top are String related classes/types.
    To make sure you only see your app's classes, type in the first row (named <Regex>) your app's package name. It is the same you entered for the 'dumpsys' command, at the start of this article. After you hit enter, you'll see only classes from that package onwards are shown.
    You see already immediately at the top which classes (instances) appear more than once and how much memory is retained by them. Getting there!

    Legend: "Shallow heap is the memory consumed by one object. Retained set of X is the set of objects that will be garbage collected if X is garbage collected. Retained heap of X is the sum of shallow sizes of all objects in the retained set of X , i.e. memory kept alive by X."

  10. Since at the start of these steps I recommended (and so do some of the referenced articles :) to repeat opening and closing the offending Activity a couple of times (say 5), you can now already see if the Activity you opened & closed is cleaning up correctly. If the row with its classname has a number > 1 in the Objects column (maybe even 5) you know it's not cleaned/cleaning up properly.
    Note that even after you fixed all your memory leaks, you still might see one entry present. When you drill down that one entry (see steps below) you'll see it has unknown beside its classname. My guess is that it means it is being cleaned up, or will be at the next GC cycle, so won't need further investigation.

  11. Drilling down: right-click on a row you expected to be 1 or not even present. Select


    List ojbects --> with incoming references


    (thus those objects that refer to the selected object). That gives just 1 row. If you click on that row, on the left in the Inspector view, you see what that object is "holding". Very interesting is the Attributes tab. There you can see which member variables it holds (and you might have expected to be null for example). Objects referencing the selected object appears when you unfold the row.

  12. Right-click the row and select


    Path to GC Roots --> exclude weak/soft references


    That shows the paths of the GC for the objects that are referencing the object you started drilling down on 1 step ago. So now your knowledge of the app comes in to play: should those objects still be referencing the object under scrutiny? If not why are they still doing that? Check your code, maybe need to null them explicitly in onDestroy() etc. See for more tips below.
    The reason for excluding weak and soft references is that they should get garbage collected on time anyway (by definition), so don't need to worry about them.
    Note: selecting "Merge Shortest Paths to GC roots" is also useful sometimes (less clutter).


Lessons learned

  • You might have to set all anonymous listeners to null in your onDestroy()

  • Watch that drawable callback stuff. Even if you have no static drawables, a library you're using might still keep an Activity context to a Drawable (and vice versa) around!

  • So what I did to solve the above two lessons is put the objects that refer to them in a list, which I cleanup in onDestroy(), i.e setOnClickListener(null) and object = null. Setting object to null should not really be necessary but might make it getting picked up by the GC a bit faster.

  • Handy trick (but error-prone) is to set all "big" objects to null in onDestroy() anyway. Helps you quicker see in MAT which are still around. Error-prone because: you might still have a background thread running when the onDestroy() is called. in onDestroy() you then might set objects to null, which the running thread still needs... (before onDestroy() itself finishes and thus the Activity). And thus you get NullPointerExceptions.

  • Images (Bitmaps) are not allocated in a standard Java way but via native calls; the allocations are done outside of the virtual heap, but are
    counted against it! Posts mentioning/related to this: one, two, and three.

    And that matches with what I see using MAT: the memory usage shown with 'procrank' and 'dumpsys' is much higher than what the MAT overview reports show.

    So to tackle OOMs with images, at least make sure all your references are cleaned up as described in the above steps. Also only loading in memory what you really need for an image helps. See also the next lesson learned.

  • Loading images from for example the internet are hard to handle in Android. You can get away with loading 1 or 2 images of say 200x200 pixels, but still memory usage goes really fast. BIG post on this here. Notice also that the Drawable callback is mentioned again too. Another one showing some computations of memory usage here. Biggest thing to learn from here: a PNG of 20K for an image of 200x200 pixels needs as Bitmap already about 160K (assuming 4 bytes per pixel).
    A recommended approach is this (ideas based on the Photostream demo app):

    1. First only get the image sizes via:


      BitmapFactory.Options options = new BitmapFactory.Options();
      options.inJustDecodeBounds = true;
      Bitmap tmpBitmap = BitmapFactory.decodeStream(new ByteArrayInputStream(new URL(url).openStream()), null, options);
      int height = options.outHeight;
      int width = options.outWidth;


      Now you know how big it is before even downloading it! You probably know how big the image should be drawn. So compute the scaling needed for that (normally Android would do the scaling for you at drawing time).

    2. Only then get the image with those sizes:


      options = new BitmapFactory.Options();
      options.inSampleSize = sampleSize;
      bitmap = BitmapFactory.decodeStream(new ByteArrayInputStream(new URL(url).openStream()), null, options);


    3. A further improvement (also handy for caching of images) is to just download the images as raw bytes and store that on disk. Then when it's time to create a bitmap/drawable out of it, determine if you need to rescale by reading those stored raw bytes. Just replace in the above code 'new URL(url).openStream()' with your byte array (byte[]).
      And: if you're really sure you don't need a given bitmap any more, use bitmap.recyce() to release it permantently.


  • For ListViews and their ListAdapters: use the convertView.

  • Debuggers usually keep objects alive, preventing them from being freed, so when doing this memory analysis, don't run in debug mode. Also make sure to force a GC a couple of times on your process before taking a heap dump. As tipped by Romain in this post.

Update: apparently some of the steps have been automated in the meantime, see this message for details.

Update: From this article "As of Android 3.0 (Honeycomb), the pixel data for Bitmap objects is stored in byte arrays (previously it was not stored in the Dalvik heap), and based on the size of these objects, it's a safe bet that they are the backing memory for our leaked bitmaps." So it will be much easier to track allocations. Note that this TTLNews blogpost is from before Honeycomb! The article also shows how to compare heap dumps with MAT, might come in handy some times.

Best of this Week Summary 25 January - 31 January 2010

Sunday, January 24, 2010

Best of this Week Summary 11 January - 24 January 2010

Sunday, January 10, 2010

Best of this Week Summary 28 December - 10 January 2010

  • "An interview with Duane Nickull, Senior Technical Evangelist at Adobe Systems as he revisits the notion of 'Web 2.0', and discusses some of the new architectural and human interaction patterns that are shaping the way in which we build RIA Web applications today. He talks about some of the new Flash authoring tools for the iPhone, the Open Screen Project, as well as the impact HTML 5 will have on Flash adoption." Transcription of the interview below the interview. Summary in four words: "Don't piss off users". He also mentions the Open Screen Project: "It is an industry-wide initiative, led by Adobe with the participation of other industry leaders, to enable the delivery of rich multiscreen experiences built on a consistent runtime environment for open web browsing and standalone applications."

  • Blogpost using Ehcache and Spring 3 for implementing over 100K of RSS feeds, with certain feeds under very high load. A follow-up post describes the use of Ehcache DX Monitor Module (beta).

  • Fun: a ZX-81 chess program in 1K. Actually only 672 bytes were available for the program!

Sunday, December 27, 2009

Best of this Week Summary 21 December - 27 December 2009

Sunday, December 20, 2009

Best of this Week Summary 14 December - 20 December 2009

Sunday, December 13, 2009

Best of this Week Summary 07 December - 13 December 2009

Sunday, December 6, 2009

Best of this Week Summary 30 November - 06 December 2009

Sunday, November 29, 2009

Best of this Week Summary 17 November - 29 November 2009

Sunday, November 22, 2009

Best of this Week Summary 16 November - 22 November 2009

Sunday, November 15, 2009

Best of this Week Summary 09 November - 15 November 2009

Sunday, November 8, 2009

Best of this Week Summary 02 November - 08 November 2009

  • A summary of an interview with Erich Gamma, Richard Helm, and Ralph Johnson, three of the Gang of Four who wrote Design Patterns: Elements of Reusable Object-Oriented Software 15 years ago. The full interview here.

  • Five web frameworks comparison: Shale, Struts, Wicket, WebWork, Rails, JBossSeam, MyFaces and Spring.

  • Jeff Dean (Google Fellow) on large-scale computing (PDF) during Ladis 2009. Interesting numbers regarding reliability and availability for hardware, like 1-5% of your disks will die. And even if you got very reliable servers with MTBF of 30 years, if you have 10000 of those, that means see one fail each day! And: "a web search touches 50+ separate services, 1000s machines". Some more of these quotes:

    • "Better to give users limited functionality than an error page"

    • "Ensure your design works if scale changes by 10X or 20X but the right solution for X often not optimal for 100X"

    • Monitoring: "If your system is slow or misbehaving, can you figure out why?"

    • "Future scale: ~106 to 107 machines, ~1013 directories, ~1018 bytes of storage, spread at 100s to 1000s of locations around the world, ~109 client machines"

    Other subjects touched: MapReduce and BigTable.

  • Blogpost that briefly touches a few types of complexity encountered in large software (web) projects.