Yay, my first post on Android :) Immediately attacking a difficult one: memory problems.

You might not run into them that quickly, but when you do, with a bit of bad luck, you've got a lot of work to do.
I've split the memory problems in two parts: out of memory (OOM) problems (this post) and stack overflow problems (a next post).
The maximum heap memory an process (app) gets in Android is 16M. That's not that much, a basic app takes already several MBs after you've only just started it.
So in the LogCat output you see something like when you run out of (heap) memory:
09-12 16:33:43.357: ERROR/dalvikvm-heap(157): 528640-byte external allocation too large for this process.
09-12 16:33:43.357: ERROR/(157): VM won't let us allocate 528640 bytes
09-12 16:33:43.357: DEBUG/AndroidRuntime(157): Shutting down VM
09-12 16:33:43.367: WARN/dalvikvm(157): threadid=3: thread exiting with uncaught exception (group=0x40010e28)
09-12 16:33:43.367: ERROR/AndroidRuntime(157): Uncaught handler: thread main exiting due to uncaught exception
09-12 16:33:43.387: ERROR/AndroidRuntime(157): java.lang.RuntimeException: can't alloc pixels
09-12 16:33:43.387: ERROR/AndroidRuntime(157):     at android.graphics.Bitmap.nativeCreate(Native Method)
09-12 16:33:43.387: ERROR/AndroidRuntime(157):     at android.graphics.Bitmap.createBitmap(Bitmap.java:343)
|
Now it could be you are just using too much memory. Trying to load 100 images of 800x600 pixels will just not fit into 16M when decoded to bitmaps.
But for any other "normal" app you can still run OOM after using it for a little while. For example even when you just open/close the same screen (Activity) for 20 times. That means you've got a memory leak. So where is it leaking, what memory can't the garbage collector (GC) set free?
With
you can get some information about your app's memory usage, but only a very rough idea.
A bit more specific information you can find by executing
adb shell dumpsys meminfo
|
DDMS also gives some rough info, but only some quite high-level info about objects being freed and allocated.
So still not enough info to really figure out what's going on: you'll see the memory usage will go over the 16MB limit at some point, at which the JVM will start complaining in the LogCat output it can't allocate the requested memorory.
But that you already knew :)
So you need something more detailed about what is when allocated and GC'ed. This is where the
Eclipse Memory Analyzer Tool (MAT) comes into play.
Below I'll just give the steps you could apply to figure out where you're not freeing memory correctly and thus have a memory leak(s). All steps apply for a Windows + Eclipse environment, but should not be hard to apply to other setups.
The steps are based on input from several posts:
Analyzing memory usage steps
Make sure you've got your app running in the emulator via Eclipse. A real device should also work but I didn't try it. Probably sending the signal 10 needs to be done from w/in the code, see
here. I'll assume you've already installed the MAT plugin.
- Start a Windows cmd shell. Go to the directory where you installed the Android SDK and go into the 'tools' subdirectory.
- First the directory /data/misc needs to be in mode 777 for the heap dump to be written. So execute:
adb shell chmod 777 /data/misc
|
- Now you probably already have an idea which Activity is causing the OOM or might have a memory leak. To be able to easily spot it, open and close that Activity about 5 times. This makes sure it will stand out in the heap data. And, if you've opened/closed it 5 times, it should be fully GC'ed right? So if later on we see it still has 5 or 4 instances around, you know something is not cleaned up correctly!
- Find the process id (PID) you want an heap dump for. That is your app, identified by the package path of your app. So execute to look it up:
Take the first column (named PID). Send a signal 10 to that process via:
In your LogCat output you should see the VM heap being dump with lines similar to:
01-31 15:29:34.112: INFO/dalvikvm(210): SIGUSR1 forcing GC and HPROF dump
01-31 15:29:34.112: INFO/dalvikvm(210): hprof: dumping VM heap to "/data/misc/heap-dump-tm1264948174-pid210.hprof-hptemp".
01-31 15:29:35.873: INFO/dalvikvm(210): hprof: dumping heap strings to "/data/misc/heap-dump-tm1264948174-pid210.hprof".
01-31 15:29:36.652: INFO/dalvikvm(210): hprof: heap dump completed, temp file removed
|
- Now you need to copy the generated .hprof file from the emulator (or device) to your Windows machine, so execute:
adb pull /data/misc/heap-dump-tm1264948174-pid210.hprof myheapdump.hprof
|
Note that the bold part in the command matches the bold part in the 3rd LogCat line above.
- Since the hprof output from the Dalvik VM is not in the format the standard Java tools (including MAT) recognize, you need to fix that with this command (it just prepends a header or something):
hprof-conv myheapdump.hprof mat_myheapdump.hprof
|
- As an extra step you can move the mat_myheapdump.prof file to another directory, so you won't fill up your working directory with .hprof files.
- Switch to the MAT perspective and open the file mat_myheapdump.prof you just created above. MAT will give you the option to already look at a few standard reports that could already give you an indication on what is using up a lot of memory. But often it will report 'java.lang.Class' and 'java.lang.string' as suspects, thus not telling you that much. Therefore: see next step.
- Click on the histogram icon:
 That gives something like this:
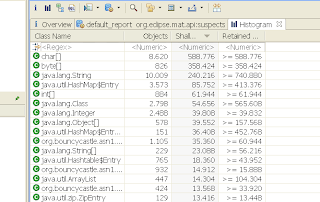 That just shows all classes in the heap dump. Note that again on top are String related classes/types.
To make sure you only see your app's classes, type in the first row (named <Regex>) your app's package name. It is the same you entered for the 'dumpsys' command, at the start of this article. After you hit enter, you'll see only classes from that package onwards are shown.
You see already immediately at the top which classes (instances) appear more than once and how much memory is retained by them. Getting there!
Legend: "Shallow heap is the memory consumed by one object. Retained set of X is the set of objects that will be garbage collected if X is garbage collected. Retained heap of X is the sum of shallow sizes of all objects in the retained set of X , i.e. memory kept alive by X."
- Since at the start of these steps I recommended (and so do some of the referenced articles :) to repeat opening and closing the offending Activity a couple of times (say 5), you can now already see if the Activity you opened & closed is cleaning up correctly. If the row with its classname has a number > 1 in the Objects column (maybe even 5) you know it's not cleaned/cleaning up properly.
Note that even after you fixed all your memory leaks, you still might see one entry present. When you drill down that one entry (see steps below) you'll see it has unknown beside its classname. My guess is that it means it is being cleaned up, or will be at the next GC cycle, so won't need further investigation.
- Drilling down: right-click on a row you expected to be 1 or not even present. Select
List ojbects --> with incoming references
|
(thus those objects that refer to the selected object). That gives just 1 row. If you click on that row, on the left in the Inspector view, you see what that object is "holding". Very interesting is the Attributes tab. There you can see which member variables it holds (and you might have expected to be null for example). Objects referencing the selected object appears when you unfold the row.
- Right-click the row and select
Path to GC Roots --> exclude weak/soft references
|
That shows the paths of the GC for the objects that are referencing the object you started drilling down on 1 step ago. So now your knowledge of the app comes in to play: should those objects still be referencing the object under scrutiny? If not why are they still doing that? Check your code, maybe need to null them explicitly in onDestroy() etc. See for more tips below.
The reason for excluding weak and soft references is that they should get garbage collected on time anyway (by definition), so don't need to worry about them.
Note: selecting "Merge Shortest Paths to GC roots" is also useful sometimes (less clutter).
Lessons learned
- You might have to set all anonymous listeners to null in your onDestroy()
- Watch that drawable callback stuff. Even if you have no static drawables, a library you're using might still keep an Activity context to a Drawable (and vice versa) around!
- So what I did to solve the above two lessons is put the objects that refer to them in a list, which I cleanup in onDestroy(), i.e setOnClickListener(null) and object = null. Setting object to null should not really be necessary but might make it getting picked up by the GC a bit faster.
- Handy trick (but error-prone) is to set all "big" objects to null in onDestroy() anyway. Helps you quicker see in MAT which are still around. Error-prone because: you might still have a background thread running when the onDestroy() is called. in onDestroy() you then might set objects to null, which the running thread still needs... (before onDestroy() itself finishes and thus the Activity). And thus you get NullPointerExceptions.
- Images (Bitmaps) are not allocated in a standard Java way but via native calls; the allocations are done outside of the virtual heap, but are
counted against it! Posts mentioning/related to this: one, two, and three.
And that matches with what I see using MAT: the memory usage shown with 'procrank' and 'dumpsys' is much higher than what the MAT overview reports show.
So to tackle OOMs with images, at least make sure all your references are cleaned up as described in the above steps. Also only loading in memory what you really need for an image helps. See also the next lesson learned.
- Loading images from for example the internet are hard to handle in Android. You can get away with loading 1 or 2 images of say 200x200 pixels, but still memory usage goes really fast. BIG post on this here. Notice also that the Drawable callback is mentioned again too. Another one showing some computations of memory usage here. Biggest thing to learn from here: a PNG of 20K for an image of 200x200 pixels needs as Bitmap already about 160K (assuming 4 bytes per pixel).
A recommended approach is this (ideas based on the Photostream demo app):
- First only get the image sizes via:
BitmapFactory.Options options = new BitmapFactory.Options();
options.inJustDecodeBounds = true;
Bitmap tmpBitmap = BitmapFactory.decodeStream(new ByteArrayInputStream(new URL(url).openStream()), null, options);
int height = options.outHeight;
int width = options.outWidth;
|
Now you know how big it is before even downloading it! You probably know how big the image should be drawn. So compute the scaling needed for that (normally Android would do the scaling for you at drawing time).
- Only then get the image with those sizes:
options = new BitmapFactory.Options();
options.inSampleSize = sampleSize;
bitmap = BitmapFactory.decodeStream(new ByteArrayInputStream(new URL(url).openStream()), null, options);
|
- A further improvement (also handy for caching of images) is to just download the images as raw bytes and store that on disk. Then when it's time to create a bitmap/drawable out of it, determine if you need to rescale by reading those stored raw bytes. Just replace in the above code 'new URL(url).openStream()' with your byte array (byte[]).
And: if you're really sure you don't need a given bitmap any more, use bitmap.recyce() to release it permantently.
- For ListViews and their ListAdapters: use the convertView.
- Debuggers usually keep objects alive, preventing them from being freed, so when doing this memory analysis, don't run in debug mode. Also make sure to force a GC a couple of times on your process before taking a heap dump. As tipped by Romain in this post.
Update: apparently some of the steps have been automated in the meantime, see
this message for details.
Update: From
this article "As of Android 3.0 (Honeycomb), the pixel data for Bitmap objects is stored in byte arrays (previously it was not stored in the Dalvik heap), and based on the size of these objects, it's a safe bet that they are the backing memory for our leaked bitmaps." So it will be much easier to track allocations. Note that this TTLNews blogpost is from before Honeycomb! The article also shows how to compare heap dumps with MAT, might come in handy some times.


 Del.icio.us
 DZone
DZone
 Reddit
 Digg
Digg